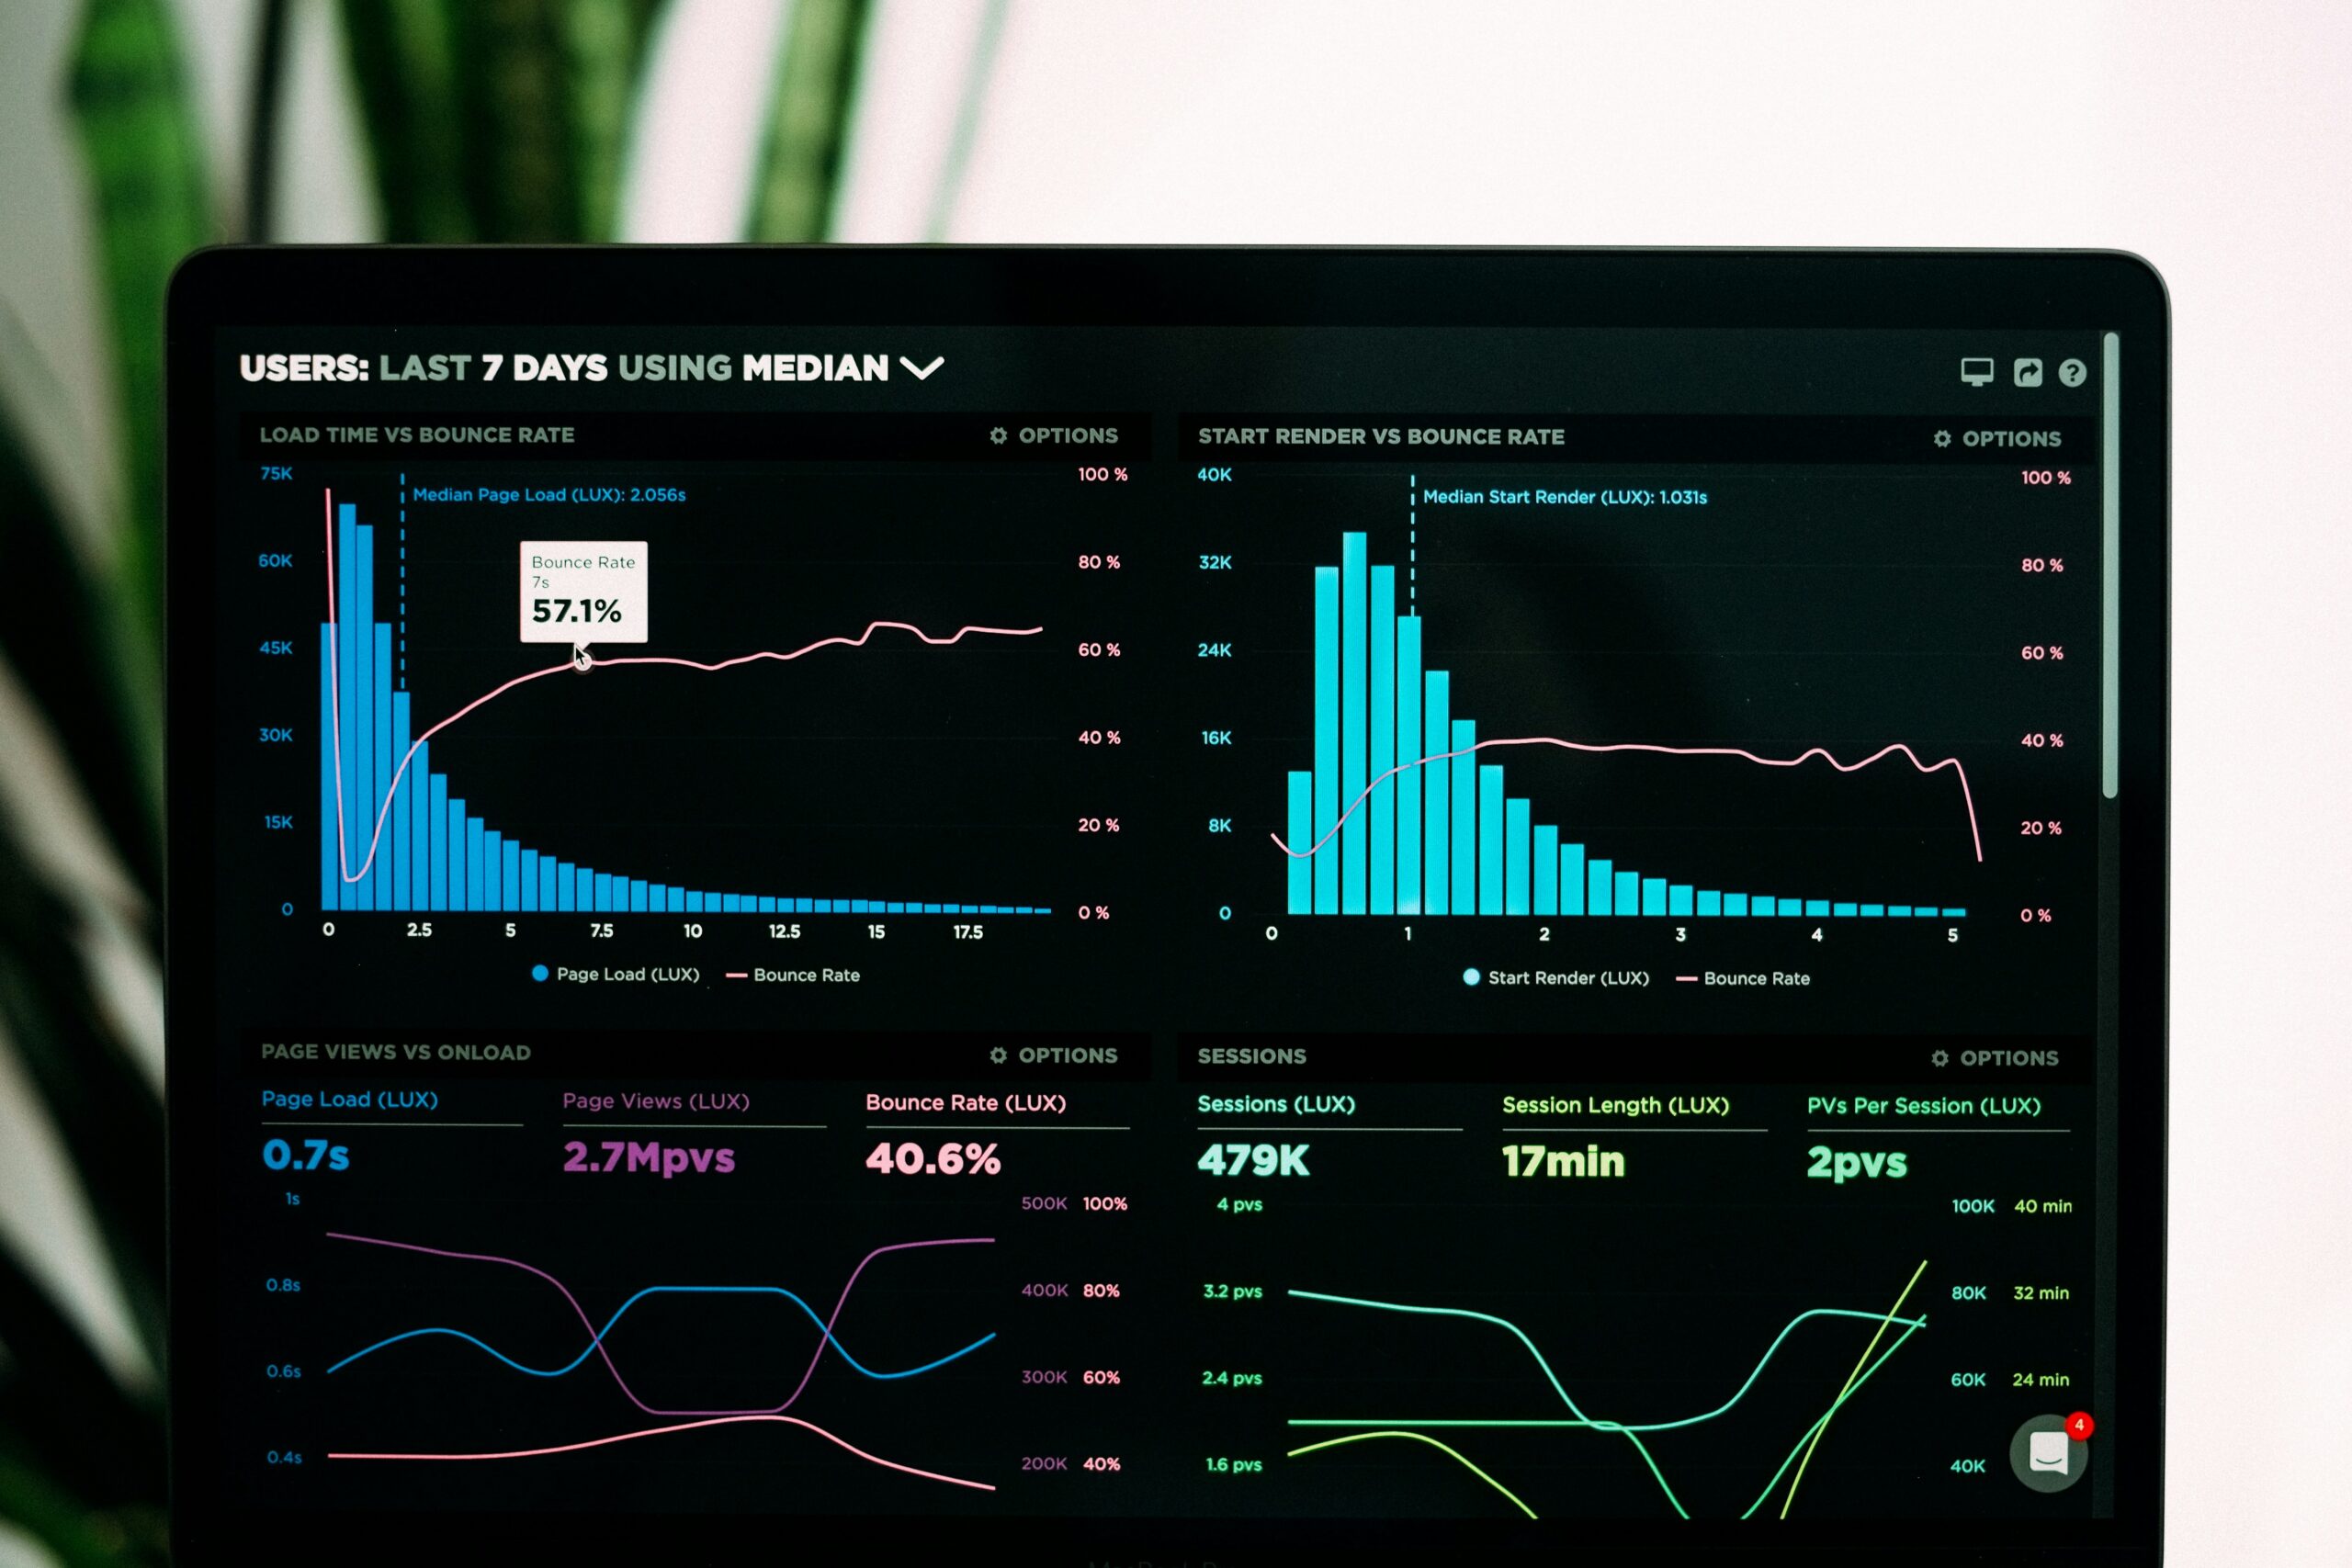
In today’s data-driven world, businesses rely on data analysis tools to unlock the potential of their data. Choosing the right tool can make the difference between gaining a competitive edge or being left behind. Whether you’re a data scientist, business analyst, or project manager, having the best tools at your disposal is crucial for turning raw data into actionable insights.
In this guide, we’ll explore some of the top data analysis tools available in 2024, evaluating their features, use cases, and which users can benefit the most. We will also highlight key considerations when selecting the right tool for your specific needs.
What Are Data Analysis Tools?
Data analysis tools are software applications that allow users to process, analyze, and visualize data to discover patterns, trends, and insights. These tools help businesses make data-driven decisions, streamline operations, and enhance productivity.
Modern data analysis platforms can perform a range of functions:
- Data mining: Identifying patterns in large datasets.
- Statistical analysis: Applying mathematical techniques to understand relationships between data points.
- Predictive analytics: Forecasting future trends based on current and historical data.
- Data visualization: Creating visual representations of complex datasets to make them easier to interpret.
1. RapidMiner

RapidMiner is a popular open-source data science platform used for data preparation, machine learning, and predictive analytics. It provides a wide range of tools for performing complex data analyses without needing to write code. Its drag-and-drop interface makes it accessible even to those without extensive technical knowledge.
Key Features:
- No-code environment: Great for beginners and non-technical users.
- Data mining: RapidMiner is one of the best tools for uncovering hidden patterns in large datasets.
- Automation: Streamlines workflows by automating repetitive tasks.
- Integrations: Works seamlessly with other popular tools such as Python, R, and TensorFlow.
Best For:
- Business analysts looking for an easy-to-use platform for performing predictive analytics.
- Data scientists needing an end-to-end platform for data processing, modeling, and deployment.
2. KNIME

KNIME (Konstanz Information Miner) is another powerful, open-source tool that excels in data mining, machine learning, and data visualization. It’s favored for its flexibility and modular design, allowing users to build custom workflows tailored to their needs.
Key Features:
- Modular design: Build workflows using a wide range of nodes for various tasks.
- Visualization: KNIME provides a comprehensive suite of data visualization tools.
- Advanced analytics: Offers integration with Python and R for more advanced data manipulation.
Best For:
- Researchers and data scientists who need a tool capable of handling complex data science tasks.
- Organizations that require flexible, customizable solutions for data analysis.
3. Tableau

Tableau is one of the leading data visualization tools used globally by businesses of all sizes. It allows users to create visually stunning, interactive dashboards that help simplify complex data.
Key Features:
- User-friendly interface: Ideal for non-technical users looking to create visual reports.
- Data blending: Tableau’s ability to combine data from different sources is a significant advantage.
- Real-time analysis: Provides instant insights by connecting to live data.
Best For:
- Business users looking for intuitive tools to present data findings.
- Marketing and sales teams needing real-time data insights for decision-making.
4. Google Charts

Google Charts is a web-based tool for creating simple, customizable charts and graphs. It’s often used to complement more robust data analysis platforms, providing lightweight and easy-to-integrate data visualization solutions.
Key Features:
- Free to use: Ideal for small businesses or individuals.
- Customizable: Charts can be tailored to fit your specific needs.
- Easy to share: Embedding charts into websites or reports is seamless.
Best For:
- Small businesses and freelancers needing an affordable solution for basic data visualization.
- Web developers looking to integrate interactive charts into web pages.
5. Microsoft Excel and Power BI

Microsoft’s suite of data analysis tools remains a staple in the business world. Excel is perfect for basic to intermediate data analysis, while Power BI takes things further, offering advanced analytics and data visualization capabilities.
Key Features:
- Excel: A spreadsheet-based tool that can perform various types of data analysis, including statistical analysis, forecasting, and data manipulation.
- Power BI: Connects to multiple data sources, offering comprehensive business intelligence solutions through dashboards and reports.
- Ease of use: Familiar interface for most business users.
Best For:
- Small to medium-sized businesses that require basic analysis and reporting.
- Business analysts seeking more advanced features, especially in Power BI.
6. Orange

Orange is an open-source data visualization and analysis tool tailored for those in academia and data science. It offers both novice and expert users an easy way to analyze data through a visual programming environment.
Key Features:
- Visual programming: Design workflows by dragging and dropping components.
- Data visualization: Extensive tools for creating charts, heatmaps, and more.
- Add-ons: A wide array of add-ons for text mining, bioinformatics, and machine learning.
Best For:
- Students and researchers looking for a free, educational tool for data analysis.
- Data scientists needing a flexible platform for experimental analysis.
7. Datawrapper

Datawrapper is a tool designed for creating easy-to-understand data visualizations, such as charts, maps, and tables. It is widely used by journalists and communication teams who need to present data in a clear, concise way.
Key Features:
- Ease of use: Extremely user-friendly for creating interactive charts.
- Customizable designs: Allows users to tailor visualizations to their branding.
- No coding required: Perfect for non-technical users.
Best For:
- Journalists and communication professionals who need quick and effective data visualizations.
- Content creators aiming to enhance their reports or presentations with data-driven visuals.
Choosing the Right Data Analysis Tool
With so many tools available, selecting the right one can feel overwhelming. Here are key factors to consider:
1. Complexity of Your Data
For those dealing with large, complex datasets, a tool like KNIME or RapidMiner is a good choice. These platforms are designed to handle intricate analysis tasks, from data mining to predictive modeling.
2. User Skill Level
If you’re new to data analysis, opt for a user-friendly tool like Tableau or Google Charts. These platforms offer a more intuitive interface, making it easier for beginners to create visualizations and perform basic analysis.
3. Budget Constraints
Free and open-source tools such as KNIME and Orange offer robust functionality without the cost, making them ideal for small businesses and startups with limited budgets.
4. Integration Needs
If you need to integrate with other tools or platforms, consider options like Power BI or RapidMiner, which offer seamless integration with external data sources and other analytics platforms.
FAQs
1. What are the most commonly used data analysis tools?
Some of the most popular data analysis tools include Tableau, RapidMiner, KNIME, Power BI, and Google Analytics. These platforms cater to various needs, from data visualization to machine learning and predictive analytics.
2. Can non-technical users use data analysis tools?
Yes, many modern tools like Tableau, Google Charts, and Datawrapper are designed with non-technical users in mind. They feature drag-and-drop interfaces and easy-to-use dashboards that require no coding knowledge.
3. What’s the best data analysis tool for small businesses?
For small businesses with limited budgets, Google Charts or Microsoft Excel may be the most appropriate. Both are affordable and easy to use while offering powerful data analysis capabilities.
4. Are there free data analysis tools available?
Yes, there are several free and open-source tools, including KNIME, Orange, and Google Charts, that provide excellent functionality without the cost of premium platforms.
5. How do I choose the best data analysis tool for my needs?
Consider the complexity of your data, your budget, and your level of expertise when selecting a tool. For example, non-technical users may prefer Tableau, while advanced users may benefit from KNIME or RapidMiner.
Conclusion: Find the Best Data Analysis Tool for Your Needs
Choosing the right data analysis tool depends on your specific needs, the complexity of your data, and your budget. Whether you’re looking for advanced data mining capabilities or intuitive visualizations, the tools highlighted in this guide can help you gain valuable insights from your data.
For further guidance on data analysis and selecting the right tools, explore our other related articles:
Ready to take your data analysis to the next level?
Contact us today for expert advice and personalized tool recommendations!


